Pendragon Forms can serve as a great way to collect all types of data. However, sometimes you need an equally great way to display that data in a format which is easy to read and understand.
By using interfaces like QlikView, it allows you to access your collected data and display the results in numerous ways:
![]()
![]()
![]()
![]()
![]()

Depending on the version of QlikView that you are using, if you have not already done so, you will need to download and install QlikView. Visit their homepage at http://www.qlik.com/ for download and installation instructions. For this example, we are using the free version of QlikView Sense.
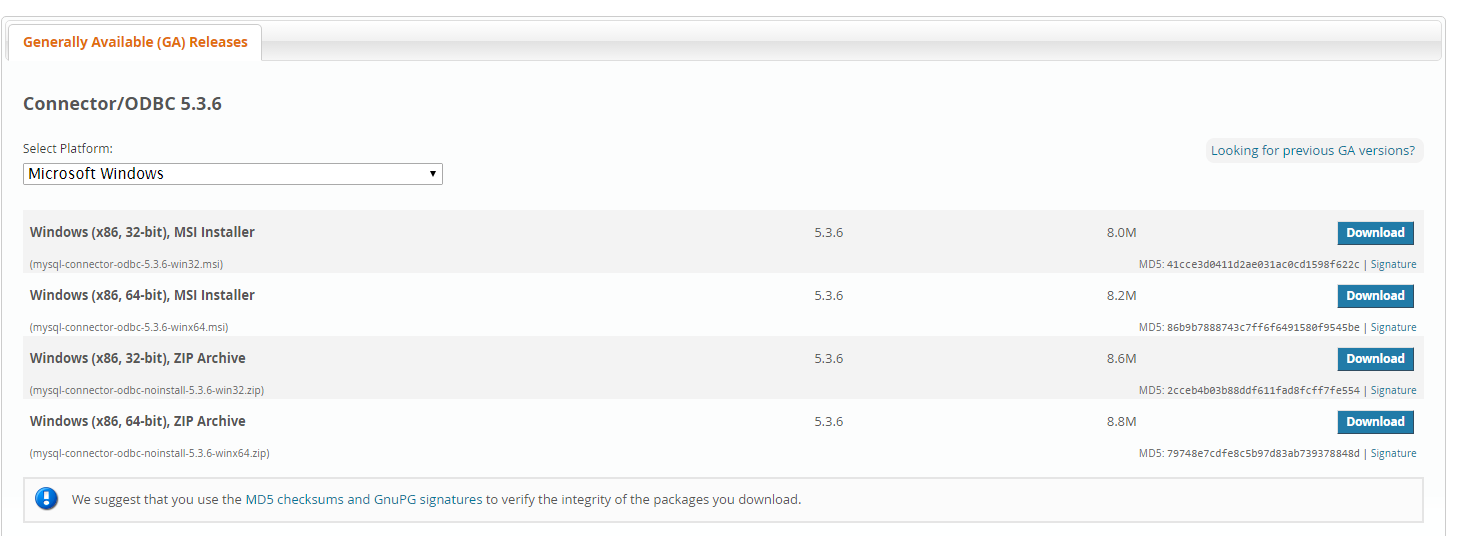
If you have not already done so, you will need to download and install the MySQL ODBC driver to communicate with your database. Download the MySQL ODBC drivers and install them if you do not already have them installed. Follow the steps provided to complete the installation.
Contact Pendragon Forms and request access to your database. You can reach us at support@pendragonforms.com.
If you need assistance configuring ODBC on your Windows machine, we have a step-by-step walkthrough on our support page:
Server Data Options
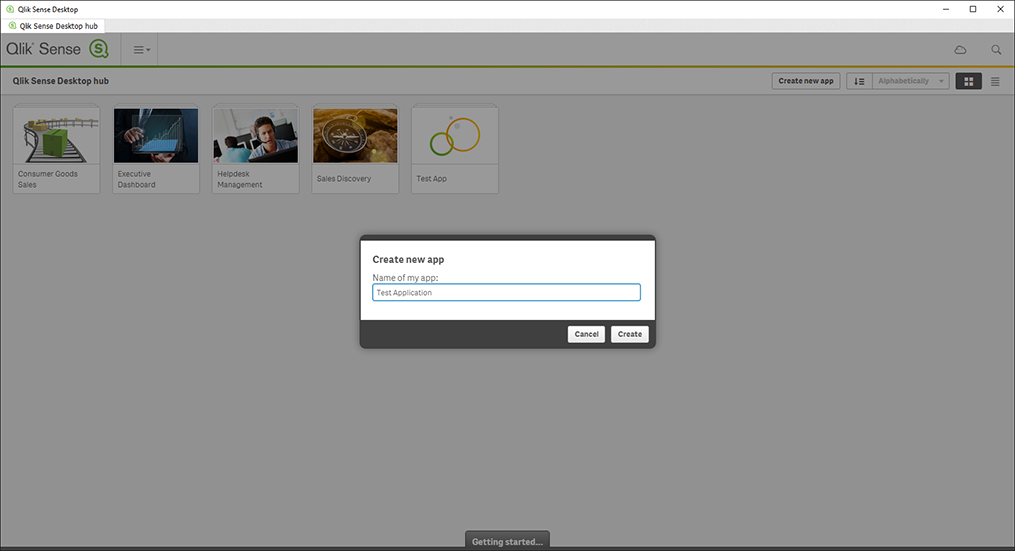
Open QlikView and start a new application. For this example, we are using QlikView Sense.
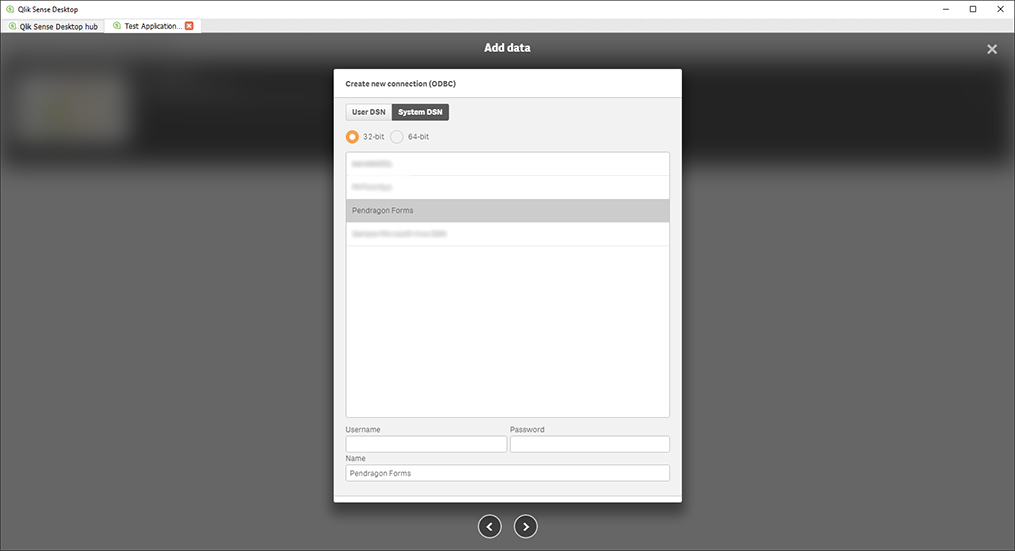
Click on "Add Data", click on "Connect my data", and select "ODBC".
Select "System DSN", and "32-bit" (or 64-bit depending on how you configured your ODBC), and you should see the "Pendragon Forms" connector on the list.
Select the database connection created earlier and click on the right arrow (>).
Select the tables to add (form_id_*) where * is the form ID with your data and make sure sure the columns of data you wish to add are checked.
Click "Load data and finish".
In QlikView, you can begin to add charts and fields, using the data sources from Pendragon Forms.
Where we don't go into detail on how to fully use QlikView, you can see their tutorials at their Demo site at http://sense-demo.qlik.com/.
![]()
(847) 816-9660
info@pendragonforms.com
Copyright © 2021 Pendragon Software Corporation. All Rights Reserved.